In the world of stock market analysis, candlestick patterns play a significant role in understanding market sentiment and predicting price movements. Two key concepts stand out among the various candlestick patterns: bullish and bearish candlesticks. As a trader, it is crucial to grasp the difference between these patterns and their implications for the market. In this article, you will explore the distinctions between bullish and bearish candlesticks and how they can guide our trading decisions.
The Characteristics of Bullish Candlesticks
A bullish candlestick represents a positive market sentiment, indicating buyers dominated the trading session. These candlesticks are typically associated with upward price movements and signal potential opportunities for traders. Here are some key characteristics of bullish candlesticks:
- Body Color: Bullish candlesticks have a green or white body, indicating that the closing price is higher than the opening price. The larger the body, the stronger the bullish momentum.
- Upper Shadow: Bullish candlesticks may have a small or no upper shadow, indicating that the high price reached during the session was close to the closing price. This suggests a strong buying interest.
- Lower Shadow: Bullish candlesticks often have a longer lower shadow, indicating that the price dipped significantly during the session but eventually closed higher. This shows that buyers stepped in to drive the price back up.
Bullish candlesticks provide a visual representation of optimism and strength in the market. They suggest that the buying pressure is higher than the selling pressure, potentially leading to upward price movements.
The Characteristics of Bearish Candlesticks
On the other hand, bearish candlesticks reflect negative market sentiment, indicating that sellers have dominated the trading session. These candlesticks are typically associated with downward price movements and signal potential opportunities for traders. Here are some key characteristics of bearish candlesticks:
- Body Color: Bearish candlesticks have a red or black body, indicating that the closing price is lower than the opening price. The larger the body, the stronger the bearish momentum.
- Upper Shadow: Bearish candlesticks may have a small or no upper shadow, indicating that the high price reached during the session was close to the opening price. This suggests a strong selling interest.
- Lower Shadow: Bearish candlesticks often have a longer lower shadow, indicating that the price briefly rallied during the session but eventually closed lower. This shows that sellers took control and pushed the price down.
Bearish candlesticks represent pessimism and weakness in the market. Thereupon, they also suggest that the selling pressure is higher than the buying pressure, potentially leading to downward price movements.
Identifying Bullish and Bearish Candlestick Patterns
While understanding the characteristics of individual candlesticks is important, you can often look for patterns formed by multiple candlesticks to gain more insights into market trends. These patterns can provide valuable information about potential trend reversals or continuations. Let’s explore some common bullish and bearish candlestick patterns:
Bullish Candlestick Patterns
- Hammer: The hammer pattern consists of a small body with a long lower shadow, resembling a hammer. It indicates a potential bullish reversal after a downtrend.
Source: Learn Stock Market
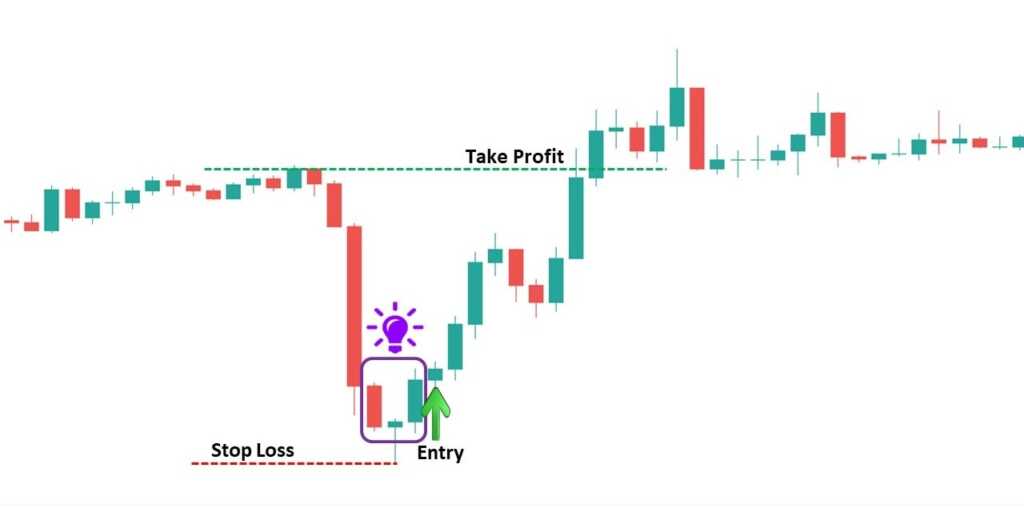
- Morning Star: The morning star pattern is a three-candle pattern. It starts with a bearish candle, followed by a small-bodied candle that reflects market indecision and ends with a bullish candle. It suggests a potential trend reversal from bearish to bullish.

Source: How to Trade Blog
- Bullish Engulfing: The bullish engulfing pattern occurs when a small bearish candle is followed by a larger bullish candle that completely engulfs the previous candle. It indicates a potential bullish reversal.
Source: How to Trade Blog
Bearish Candlestick Patterns
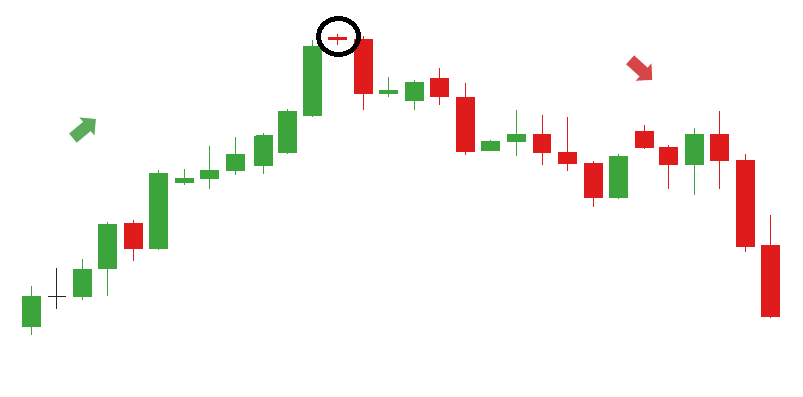
- Shooting Star: The shooting star pattern has a small body with a long upper shadow, resembling a shooting star. It indicates a potential bearish reversal after an uptrend.
Source: The Forex Geek
- Evening Star: The evening star pattern is a three-candle pattern. It starts with a bullish candle, followed by a small-bodied candle that reflects market indecision, and ends with a bearish candle. It suggests a potential trend reversal from bullish to bearish.

Source: DailyFX
- Bearish Engulfing: The bearish engulfing pattern occurs when a small bullish candle is followed by a larger bearish candle that completely engulfs the previous candle. It indicates a potential bearish reversal.
Source: Learn Stock Market
Learning Candlestick Patterns and Their Significance
Learning to identify and interpret candlestick patterns is a valuable skill for traders. By understanding the difference between bullish and bearish candlesticks and recognizing various patterns, you can gain insights into market sentiment and make more informed trading decisions. Upsurge.club offers a comprehensive Candlestick Trading course that can help you develop a deep understanding of candlestick patterns and their significance in the stock market.
The Importance of Learning Candlestick Patterns
- Market Analysis: Candlestick patterns provide valuable insights into market sentiment, allowing you to assess the balance between buyers and sellers. By recognizing these patterns, you can anticipate potential trend reversals or continuations.
- Timing Entry and Exit: Understanding candlestick patterns can help you time your entry and exit points more effectively. You may choose to enter a trade by identifying bullish patterns, while recognizing bearish patterns may signal the need to exit or consider short positions.
- Risk Management: Candlestick patterns can also assist in risk management. They provide visual cues to help you set stop-loss orders and, more accurately, determine risk-reward ratios.
Conclusion
Understanding the difference between bullish and bearish candlesticks is essential for traders. By recognizing the characteristics of these patterns and learning to identify various candlestick patterns, you can gain valuable insights into market sentiment and make more informed trading decisions. Through continuous learning and practice, you can sharpen your skills in analyzing candlestick patterns and increase your chances of success in the stock market.
To enhance your knowledge and skills in candlestick trading, consider enrolling in Upsurge.club’s Candlestick Trading course. This comprehensive course is designed to give you a deeper understanding of candlestick patterns, their interpretation, and their application in real-world trading scenarios. Through interactive lessons, practical examples, and expert guidance, you can develop the confidence and competence to navigate the stock market using candlestick analysis.


