How to read stock market charts is often a crucial question traders face, especially beginners. Stock market charts visually represent a stock’s price movements over time. They offer valuable information to help traders decide about buying and selling stocks.
Understanding these charts is crucial for you as a trader because they provide insights into market trends, patterns, and potential future movements. By learning to interpret stock market charts, you can effectively identify potential profit opportunities and mitigate risks.
In this article, we’ll explore the basics of reading stock market charts so that you can interpret and analyze the data better, enhancing your ability to operate and potentially succeed as a trader.
Steps to Read Stock Market Charts
A stock chart is a visual representation of a stock’s price movement over a specific period of time. It typically plots the stock’s price on the y-axis (vertical) and time on the x-axis (horizontal). Stock charts can take various forms, including line charts, bar charts, and candlestick charts, each offering different insights into the price behaviour of a stock.
These charts are essential tools for traders, allowing them to analyze past performance, identify trends, and make informed decisions about buying, selling, or holding stocks. Here’s a basic guide on how to read stock market charts:
Choose the Right Chart Type
Start by picking the right type of chart for your analysis. There are a few common options, like line charts, bar charts, and candlestick charts. Each chart type has its independent benefits and is useful for different kinds of analysis.
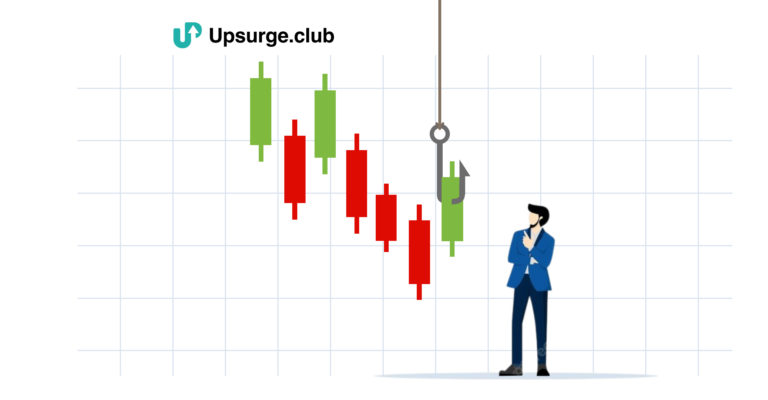
Line charts are simple and show the stock’s closing prices over time. Bar charts provide more detail, showing opening, high, low, and closing prices. Candlestick charts offer visual patterns that help predict future price movements.
Understand Time Frames
Choose a suitable time frame when reading stock charts, like daily or weekly. This helps align your analysis with your goals.
Different time frames provide varying insights into stock price movements, allowing you to focus on short-term trends for day trading or longer-term trends for trading decisions.
Adjust the time frame based on your strategy and the level of detail you need for effective analysis.
Identify Price Axes
On a stock chart, the vertical axis (y-axis) represents the stock price, while the horizontal axis (x-axis) represents time.
The vertical scale shows the price changes, helping you understand the magnitude of movements.
Pay attention to the numbers on the y-axis to check and understand how much the stock’s value has fluctuated over a given time period.
Interpret Trendlines
Drawing trendlines on stock charts helps identify the overall trend. An upward trend is marked by higher highs and higher lows, indicating positive momentum.
On the other hand, a downward trend is characterized by lower highs and lower lows, signalling a negative trend.
Trendlines assist in recognizing the direction of price movements, helping you make informed decisions based on the prevailing market trend.
Use Technical Indicators
Technical indicators like Moving Averages (MA), Relative Strength Index (RSI), and Moving Average Convergence/Divergence (MACD) help you analyze stock market charts.
Moving Averages smooth out price data, revealing overall direction. RSI measures if a stock is overbought or oversold. These indicators guide your decisions by showing momentum and potential turning points.
If you want to learn more, check out courses for technical analysis from Upsurge.club – they’re designed to help you understand these tools in a simplified manner.
Recognize Support and Resistance Levels
Identify support (price floor) and resistance (price ceiling) levels on stock charts. Support is where prices historically do not drop below a specific level, and resistance is where they struggle to rise above a specific level.
Recognizing these levels helps predict potential price movements and decide entry or exit points in trading.
Support and resistance are crucial to understanding a stock’s potential direction and making strategic decisions.
Analyze Trading Volume
Volume analysis in stock market charts involves assessing the number of shares traded. High volume often confirms a significant price movement, indicating strong market interest and potential trend continuation. On the other hand, low volume during a price change may suggest a lack of conviction.
Monitoring volume helps traders gauge the strength of price movements and make sound decisions about the market’s momentum.
Conclusion
Understanding stock market charts is like decoding a visual story of a company’s value over time. You can make informed decisions by recognizing trends, support, and resistance and using simple tools like trendlines and indicators. All you have to do is learn about market events and see their impact on charts. Practice will take you a long way. If you’re eager to level up your skills, you can take the technical analyst course on the Upsurge.club platform. It’s your key to mastering the art of reading charts and making suitable financial choices.