Are you ready to embark on a journey into the world of candlestick charting with the Heikin-Ashi strategy? If you’re new to trading or looking to expand your technical analysis toolkit, this beginner’s guide is here to illuminate the path. In this beginner’s guide to Heikin-Ashi Strategy, we’ll delve into the basics of Heikin-Ashi candlesticks and explore a simple yet powerful trading strategy using this unique charting method.
Understanding Heikin-Ashi Candles
Before we dive into the strategy, let’s start by understanding what Heikin-Ashi candles are and how they differ from traditional candlesticks.
Heikin-Ashi vs. Traditional Candlesticks
Traditional candlestick charts represent price movements within a specified time frame, such as a day, hour, or minute. Each candlestick has four components: the open, close, high, and low prices for that period. These candles provide valuable information about market sentiment, but they can sometimes be noisy, making it challenging to identify trends.
Heikin-Ashi candles, on the other hand, aim to smooth out price fluctuations and provide a clearer picture of trends. They are calculated using a modified formula based on the previous candle’s values, resulting in a different representation of price action.

Source: ig.com
Here’s how Heikin-Ashi candles are constructed:
1. Close: The close price of the current period is the average of the open, high, low, and close of the previous period.
2. Open: The open price is the average of the previous open and close.
3. High: The high price is the maximum of the current high, open, or close.
4. Low: The low price is the minimum of the current low, open, or close.
By smoothing out price data, Heikin-Ashi candles help traders identify trends more easily and reduce the impact of market noise.
Heikin-Ashi Candles Explained
Now that you understand the basics of Heikin-Ashi candles, let’s break down the key components of a Heikin-Ashi candlestick:
1. Color:
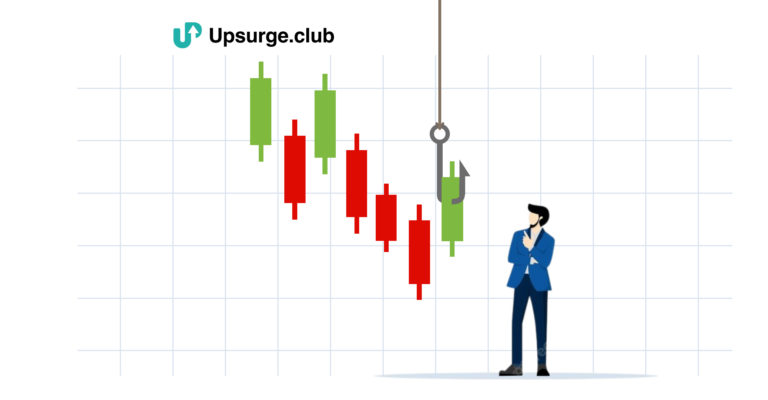
Heikin-Ashi candles come in two colors – typically red and green. The color signifies the direction of the trend. A green candle indicates a bullish (upward) trend, while a red candle represents a bearish (downward) trend.
2. Body:
The body of a Heikin-Ashi candle is the thick part between the open and close prices. It represents the price movement during the specified time period. A long body indicates strong momentum, while a short body suggests weaker momentum.
3. Shadows:
Unlike traditional candles, Heikin-Ashi candles don’t have upper and lower wicks. Instead, they may have small lines above and below the body, known as shadows. These shadows indicate the high and low prices during the period.
4. Trend Continuation:
Heikin-Ashi candles are excellent for identifying trend continuation. In an uptrend, you’ll typically see a series of green candles, while a downtrend will feature red candles. Look for consecutive candles of the same color for confirmation of the prevailing trend.
Heikin-Ashi Candle Strategy
Now that you’re familiar with Heikin-Ashi candles, let’s explore a simple yet effective trading strategy using this charting method. This strategy is designed for beginners but can be a valuable tool for traders of all levels.
Heikin-Ashi Candle Strategy Steps
Step 1: Identify the Trend
Start by identifying the prevailing trend. Look for a series of consecutive Heikin-Ashi candles of the same color. In an uptrend, you should see a sequence of green candles, while a downtrend will have red candles.
Step 2: Wait for a Pullback
After identifying the trend, wait for a pullback. This is when you see a candle of the opposite color (e.g., a red candle in an uptrend). The pullback indicates a temporary reversal.
Step 3: Entry Signal
Your entry signal occurs when the trend resumes after the pullback. In an uptrend, look for the first green candle after the red pullback candle. In a downtrend, look for the first red candle after the green pullback candle.
Step 4: Set Stop-Loss and Take-Profit
To manage risk, set a stop-loss below the low of the pullback candle (for long positions) or above the high of the pullback candle (for short positions). Determine your take-profit level based on your risk-reward ratio.
Step 5: Monitor and Adjust
Once in the trade, monitor it closely. If the trend continues in your favor, consider trailing your stop-loss to lock in profits. If the trend reverses, your stop-loss will protect you from significant losses.
Heikin-Ashi Strategy in Action
Let’s illustrate this strategy with an example:
1. You identify an uptrend with a series of green Heikin-Ashi candles.
2. A red Heikin-Ashi candle appears, signaling a pullback.
3. You enter a long position when the next green Heikin-Ashi candle forms.
4. You set a stop-loss below the low of the red pullback candle and a take-profit level based on your risk-reward ratio.
This strategy allows you to ride the trend while minimizing the impact of short-term price fluctuations.
Heiken Ashi Indicator and Further Learning
As you delve deeper into Heikin-Ashi trading, you may want to incorporate the Heiken Ashi indicator into your analysis. This indicator overlays Heikin-Ashi candles on your price chart, making it even easier to spot trends and reversals.
Conclusion
In conclusion, the Heikin-Ashi strategy is a valuable tool for traders seeking to identify and capitalize on trends in the financial markets. Its simplicity makes it accessible to beginners, while its effectiveness can benefit traders of all levels of experience. By understanding the basics of Heikin-Ashi candles and following the outlined strategy, you can enhance your trading skills and potentially improve your trading results. If you’re interested in gaining in-depth knowledge and practical skills to master this strategy and take your trading to the next level, consider enrolling in the course on Heikin-Ashi Trading Strategy offered by Upsurge.club. Happy trading!