If you’re a stock market scalper aiming to capitalize on quick trades lasting just seconds or minutes, employing technical indicators can significantly boost your trading prowess. These indicators can assist in analyzing stock price movements and identifying optimal entry and exit points. In this article, we’ll introduce you to the top five scalping indicators and show you how to leverage them for your scalp trading success.
Understanding Scalping in Trading
In trading, scalping involves buying and selling a stock within a brief timeframe, often mere seconds or minutes. It’s a strategy where you purchase a stock during minor price declines and sell it during modest upswings, even if they’re not substantial.
Due to the minimal price fluctuations, scalpers can trade in high volumes, taking numerous positions in a single session, potentially leading to higher profits. Implementing a tight stop-loss can also help mitigate losses.
The Five Best Scalping Indicators
There’s an array of stock scalping indicators designed to analyze rapid price changes in stocks. Let’s explore the five most effective indicators for scalping:
1. Simple Moving Average (SMA) Indicator
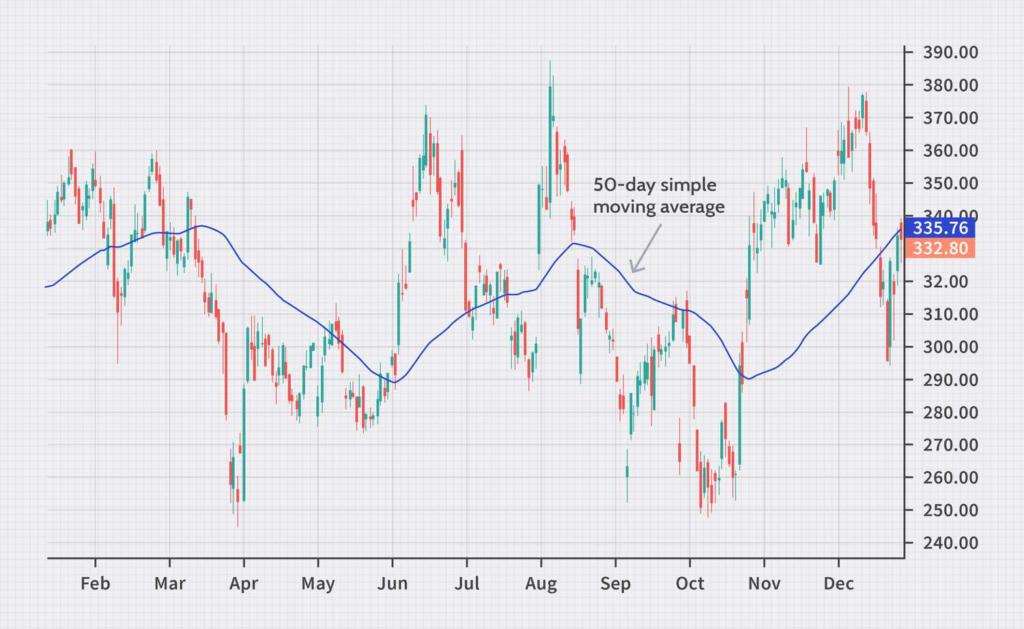
The SMA is a user-friendly technical indicator that calculates a stock’s average price over a specified period. The formula involves summing the closing prices over the chosen period and dividing by the number of days. The period can range from as short as 8 days to as long as 200 days.
Plotting these average prices on a chart creates a moving average, helping you determine whether a stock’s price is trending upward or downward. Longer periods result in greater lag, making the 8-day SMA more accurate for scalping. An upward trend in SMA signals a buy opportunity, while a downward trend suggests selling.
Source: Investopedia
2. Exponential Moving Average (EMA) Indicator
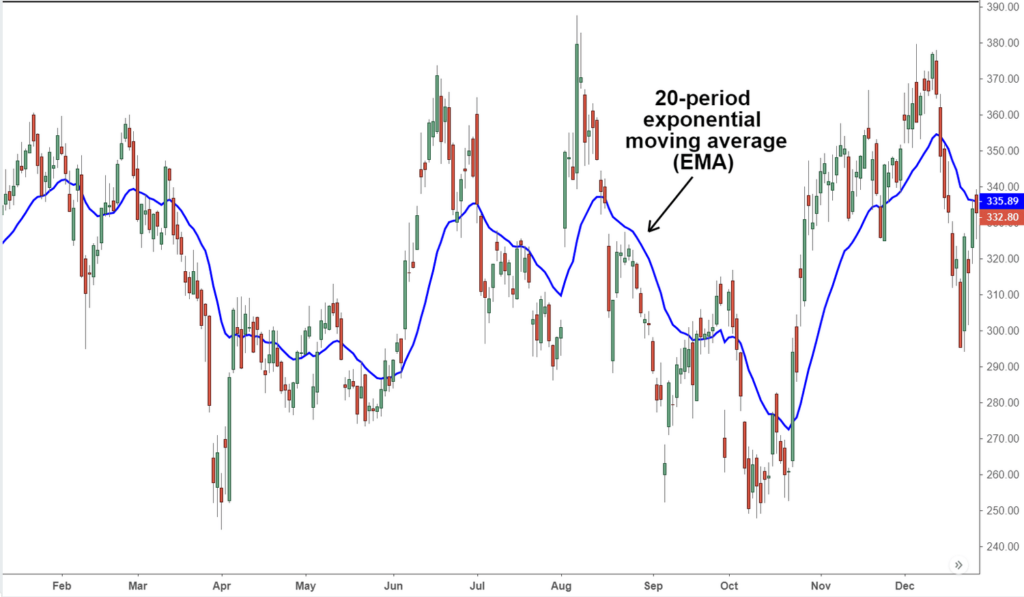
EMA differs from SMA by giving more weight to a stock’s current prices. Short-term EMAs include the 12-day and 26-day EMA, while long-term EMAs encompass the 50-day and 200-day EMA. A longer EMA period assigns less weight to current price trends.
If a stock trades above the 200-day EMA, it indicates a potential reversal in the trend of the past six months. Buy when a stock’s EMA is rising, even if the current price is falling or trading below the EMA. Conversely, sell when the opposite scenario occurs.
Source: Investopedia
3. Moving Average Convergence Divergence (MACD) Indicator
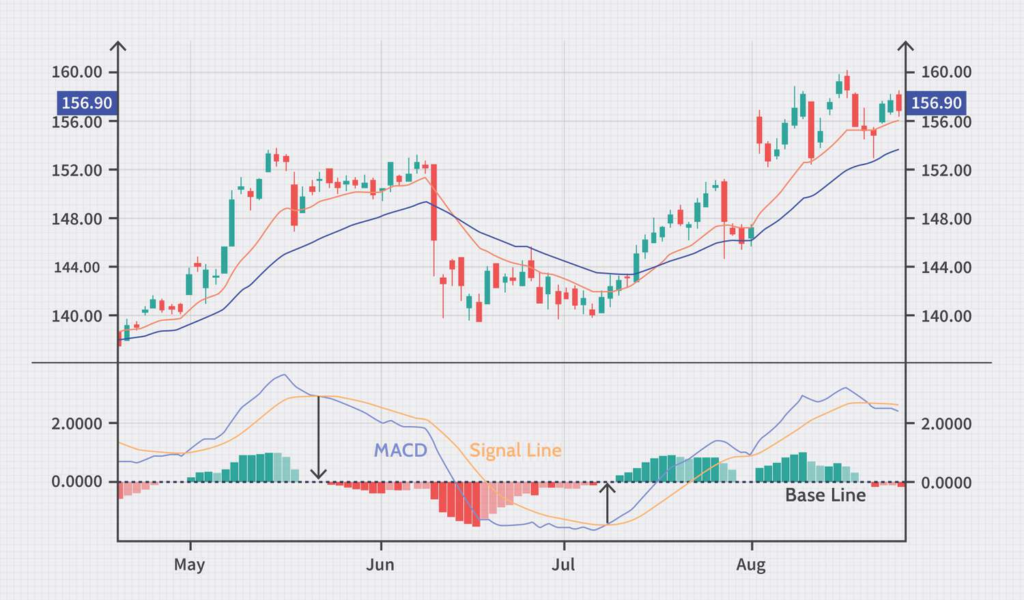
MACD ranks among the top scalping indicators. It’s a momentum indicator consisting of the MACD line, signal line, and histogram. The MACD line represents the difference between the 12-period EMA and the 26-period EMA. The signal line is the 9-period EMA, while the histogram reflects the gap between the two lines.
A MACD line crossing beneath the signal line indicates a bearish trend, and vice versa. A positive MACD with a rising histogram suggests a potential buy opportunity as prices are likely to rise. Conversely, when both the MACD and histogram decline, it’s a signal to sell.
Source: Investopedia
4. Stochastic Oscillator Indicator
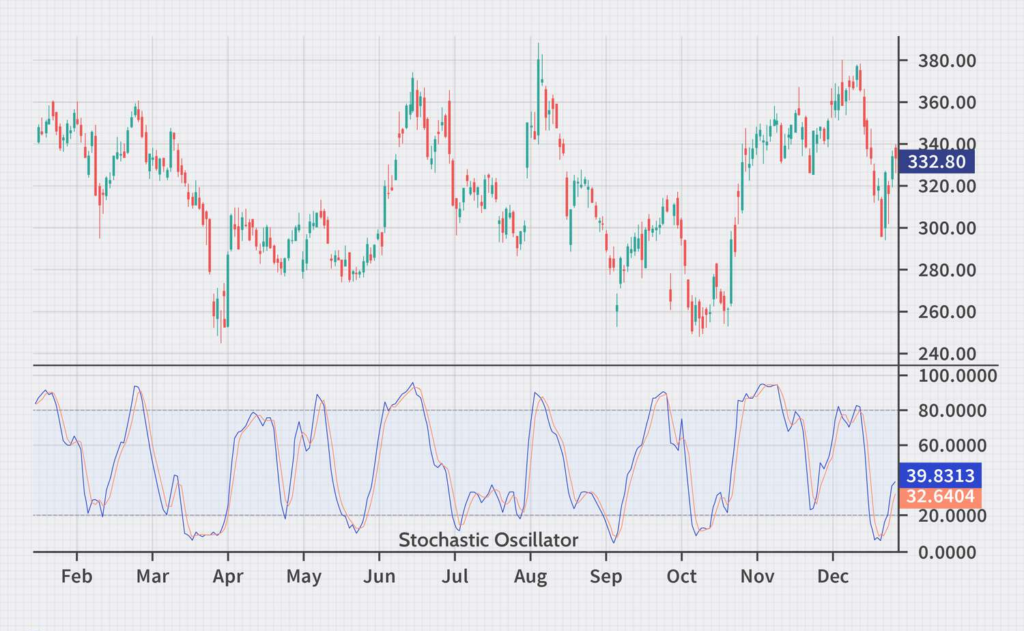
For successful scalping strategies, the stochastic oscillator is vital. It helps identify overbought or oversold conditions in a stock by comparing its closing price to the 14-day range of low and high prices. The indicator’s value can range from 0 to 100.
A value above 80 indicates an excess of buyers, while below 20 suggests an abundance of sellers. It consists of two lines: the %K line, considering recent prices, and the %D line, a 3-period MA of %K. A %K line crossing %D indicates a trend reversal.
Source: Investopedia
5. Parabolic SAR (Stop and Reverse) Indicator
The Parabolic SAR assists in determining a stock’s price direction. It displays stop and reverse points as dots above or below candlestick bars. Dots below the bars indicate a likely continuation of an upward trend, signaling a potential buy. Conversely, dots above the bars suggest a probable continuation of a downward trend, indicating a sell opportunity.
For in-depth knowledge of technical indicators for scalping, consider enrolling in a scalping course provided by Upsurge.club. In this fast-paced field, every second counts, and such a course can provide you with a competitive edge.
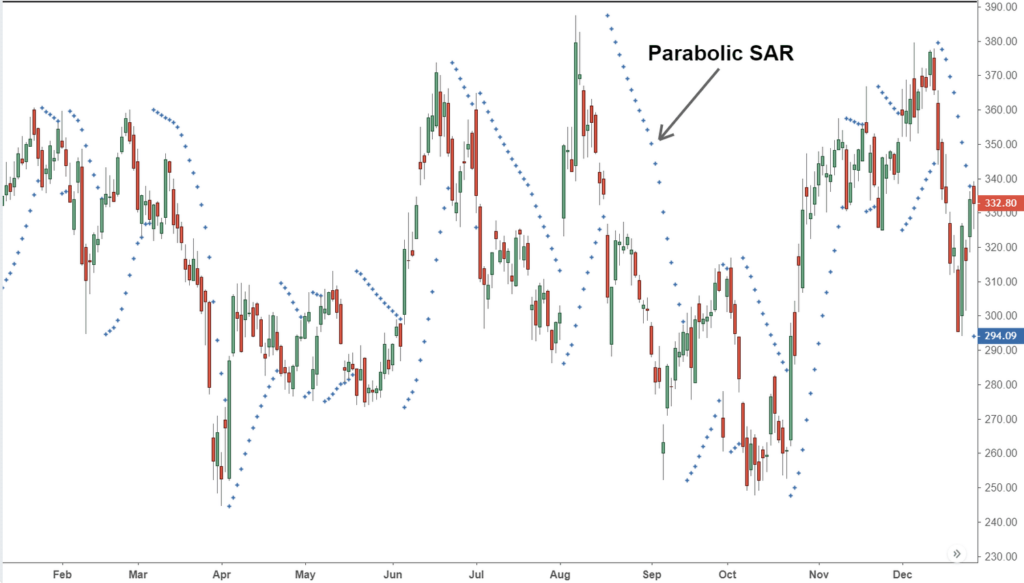
Source: Investopedia
Conclusion
To master scalping trading and execute successful entry and exit strategies in seconds or minutes, a firm grasp of technical indicators is essential. Some of the best indicators include MACD, SMA, EMA, stochastic oscillator, and Parabolic SAR.
For a comprehensive understanding of technical indicators, explore the scalping course offered by Upsurge.club. It’s a valuable resource to enhance your scalping skills and achieve success in the stock market.


