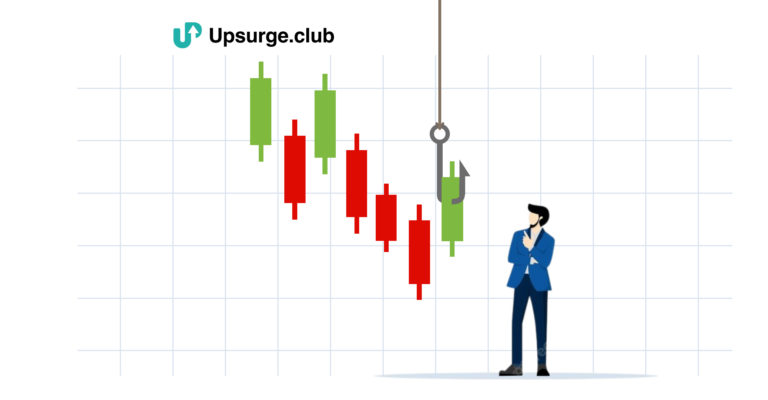
Candlestick charts are a popular tool used by traders and investors to visualize and analyze asset prices. With its visual representation of market trends and price movements, it is easy to identify potential buying and selling opportunities in the financial market. In this blog, we will provide a comprehensive guide on how to read a candlestick chart, understand its concept and composition, and read different candlestick patterns for better investment decisions.
Candlestick Charts & Their Composition
Candlestick charts are a type of financial chart used to represent the price movement of an asset, such as stocks, currencies, or commodities, over a specific period. They originated in Japan in the 1700s and have since become a widely used tool in the world of finance.
The composition of the candlestick chart consists of a series of candles, each of which represents a specific period (e.g. a day, hour, or minute). Each candlestick consists of four main parts: the body, the wick, the tail, and the shadow. Also, every candle has four points of data that are low, high, close, and open. The body of the candle represents the difference between the opening and closing price of the asset during that period.
1. Body
The body is the wide part of the candle that represents the opening and closing prices of the financial asset during the selected time period. If the closing price is higher than the opening price, the body is typically shown in green or white, signifying a bullish trend. If the closing price is lower than the opening price, the body is typically shown in red or black, signifying a bearish trend.
2. Wick or Shadow
The wick, also known as the upper or lower shadow, is the thin line that extends from the top or bottom of the body. The length of the wick represents the highest or lowest price reached during the time period, beyond the opening and closing prices.
A long upper wick indicates that the asset price reached a high level during the period, but could not sustain it. A long lower wick, on the other hand, indicates that the asset price reached a low level, but buyers eventually stepped in and pushed the price back up.
3. Tail
The tail, also known as the upper or lower part of the candle, is the thinner line that extends beyond the wick. The length of the tail indicates the overall range of the price during the selected time period.
Now that you know the different elements of candlestick charts, you will be able to analyze the data represented visually by the chart just by observing it. If you want to learn Japanese candlestick charting techniques, you must first learn how to read candlestick charts.
How to Read a Candlestick Chart?
Proper reading is essential before you start trading candlestick patterns. To gain a better understanding of market trends, read different candlestick patterns in charts using the following steps.
1. Identify the Trend
Start by determining the overall trend of the market. A bullish trend is indicated by a series of green or white candles, while a bearish trend is indicated by a series of red or black candles.
2. Look for Patterns
Candlestick charts are known for their distinctive patterns, which can provide clues about potential market trends. Bearish candlestick patterns such as bullish engulfing, hammer, and morning star and bearish candlestick patterns like bearish engulfing, shooting star, and evening star can indicate the overall market or price movement upon analysis.
3. Consider Volume
The volume of trades during a specific period can also provide important information about market sentiment. A high volume during a bullish trend suggests strong buying pressure, while a high volume during a bearish trend suggests strong selling pressure.
4. Identify Support and Resistance
Support and resistance levels are key levels where the price of an asset tends to either bounce off or break through. Identifying these levels can help traders and investors determine potential entry and exit points.
5. Monitor Key Events
Keep an eye on news and events that may impact the price of the asset, such as earnings reports, market updates, and regulatory changes. What you learn from news updates will enable you to corroborate your findings from reading the candlestick chart.
Need More? Take a Technical Analysis Course Online!
The best way to learn candlestick patterns is to take a course. A technical analysis course online usually covers everything from the basics to the identification and analysis of stock market candlestick patterns.
A course can introduce you to Japanese candlestick charting techniques that you can readily apply in your trading. If you are looking for a time and cost-efficient way to learn candlestick charts and their application, Upsurge.club provides exactly that. It covers the different types of stock market candlestick patterns along with relative analysis and set-up with moving averages.
In addition, you get to learn about a plethora of technical analysis tools you can use in conjunction with candlestick charts for smarter trading!
Conclusion
Understanding how to read candlestick charts can give traders a valuable tool to analyze market trends and make informed investment decisions. With a little practice and the knowledge of common patterns, traders can greatly increase their chances of success in the financial market. Taking technical analysis courses online from Upsurge.club is the most efficient way to learn candlestick patterns and step up your trading game.


