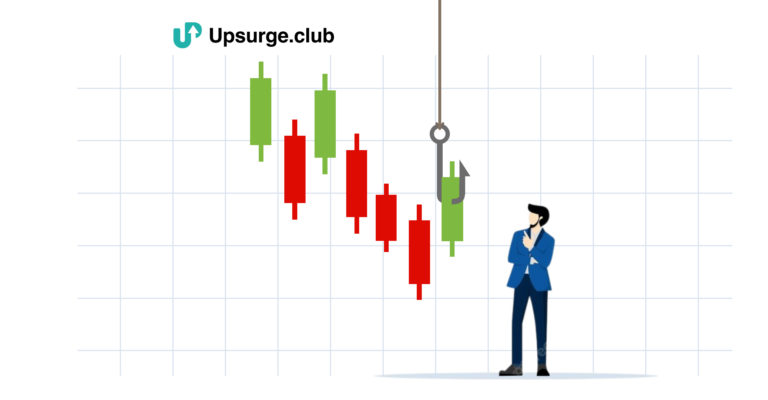
The Doji candlestick pattern is a crucial signal in candlestick charting. It appears when a security’s open and close prices are nearly identical, creating a short horizontal line with little to no body. The pattern looks like a crossroad where the market hesitates, creating a small, straight line. This candlestick has different looks – sometimes with long shadows, sometimes without any. This formation of the Doji candle suggests uncertainty and indecision between buyers and sellers that can cause a potential market reversal. This article will discuss the different types of Doji candlesticks patterns and how you can use them to make smarter trading decisions.
Types of Doji Candlestick Patterns
Understanding the significance of recognizing the Doji candlestick pattern depends on its context and the specific types of doji patterns encountered. There are six Doji candlestick types, each reflecting distinct trends and market conditions.
1. Standard Doji
A Standard Doji is a candlestick pattern showing uncertainty. When the opening and closing prices are nearly the same, it forms a small body with equal-length upper and lower shadows.
To use it, consider its context: after an uptrend, it might signal a potential reversal; in a downtrend, it could indicate a trend change. Watch for confirmation, like the next candle’s direction. If near support or resistance, it suggests a price pause.
Remember, a single Doji might not be conclusive; combine it with other indicators to make informed decisions about potential market reversals or continuations.

Source: Define Edge Securities
2. Long-Legged Doji
In the list of candlestick patterns, the “Long-Legged Doji” stands out as one of the most seen types of Doji. This pattern has an extended upper and lower shadow, surpassing those of a regular Doji. This signifies intensified uncertainty, reflecting substantial price fluctuations throughout the trading session.
The elongated wicks indicate a higher level of market indecision, where prices experienced notable upward and downward movements. This leaves you with a visual clue of hesitation and potential impending shifts in the prevailing trend.
To use it, recognise it after a trend and observe the prior price action. If it appears after a prolonged uptrend, it suggests potential reversal; after a downtrend, it might signal a reversal upwards.
Long-Legged Doji reflects uncertainty, but its reliability increases when combined with broader analysis tools.

Source: Define Edge Securities
3. Dragonfly Doji
The Dragonfly Doji appears when the open, high, and close prices of a security are nearly identical, creating a minimal body. The low of the session is substantially lower, suggesting a brief dip followed by a strong recovery.
To use it effectively, identify the Dragonfly Doji after a downtrend or during a potential reversal. It indicates potential bullish momentum, as the market rejected lower prices and buyers gained control. Confirm with other indicators like trendlines or moving averages.
Consider placing a buy order above the Doji’s high, setting a stop-loss below its low, and aiming for a target based on recent price action.

Source: Define Edge Securities
4. Gravestone Doji
The Gravestone Doji is all about reversals. Imagine an upward journey that takes a sudden U-turn. In this pattern, the open, low, and close prices mirror each other, forming almost no body.
However, the session’s high soars significantly higher. This signals a fleeting rise followed by a retreat, hinting at a potential change in direction. It’s like a flag waving on a hill: a brief ascent, then a swift descent.
Keep your eyes peeled for this pattern in your chart analysis, as it can signify a shift in market sentiment and the possibility of a downward movement ahead.

Source: Define Edge Securities
5. Four-Price Doji
The Four-Price Doji candle pattern is quite rare but holds significant meaning for your trading analysis. When you spot this pattern on your chart, it means that all four crucial prices—open, high, low, and close—are exactly the same, forming a distinct cross-like shape.
This occurrence showcases a remarkable equilibrium between buyers and sellers, suggesting a strong sense of indecision in the market.
As a trader, recognizing this unique Doji candle pattern is vital, as it can signify a potential turning point in price action.
Keep in mind that while Four-Price Doji patterns are powerful signals, they are most effective when combined with other technical indicators and contextual information to make well-informed trading decisions.

Source: Define Edge Securities
6. Rickshaw Man Doji
The Rickshaw Man Doji, a unique candlestick pattern, emerges when the open and close prices align at the midpoint of the session’s range. This forms a small body, while both upper and lower shadows are of equal length.
Imagine you’re analyzing charts: spotting this pattern suggests market balance and possible trend reversal. When the Rickshaw Man Doji appears after a prolonged trend, it could signal a potential shift in direction. Yet, it might not hold as much significance when seen during consolidation.
To learn more about what is Doji candlestick and many more different candlestick patterns, you can enroll in the Candlestick Trading course offered by Upsurge.club. In this course, you can learn how to combine candlestick patterns with other tools and indicators and enhance your trading skills.

Source: Define Edge Securities
Conclusion
Learning about different Doji candlestick patterns can greatly improve your trading skills. These simple but powerful patterns can help you spot potential trend reversals, confirm support and resistance levels, and make more informed decisions.
Remember, while Doji patterns are important, combining them with other indicators is essential for a well-rounded strategy.
To deepen your understanding, consider enrolling in the easy-to-follow candlestick trading course offered by Upsurge.club. Start your journey towards becoming a more confident trader today.