Candlestick charts are representations of how prices change in financial markets. They use individual “candles” to represent the opening, closing, highest, and lowest prices for a given time period.
The body of the candle shows the price range between the opening and closing prices, while the wicks represent the highest and lowest prices. Candlestick charts are widely used in technical analysis to analyze market trends and make trading decisions.
As a beginner, it can be challenging to understand and implement candlestick trading. However, worry not, here we provide you with candlestick trading guide for beginners that will help you understand the art of interpreting candlestick charts and recognizing various patterns to give an edge in your trading decisions.
Types of Candlestick Chart Patterns
As you learn candlestick trading, you’ll see patterns that can reveal market trends and price movements. There are three types of candlestick chart patterns: bullish, bearish, and indecisive.
1. Bullish Candlestick Patterns
Bullish patterns suggest a potential upward price movement and often indicate buying pressure in the market. Some commonly used bullish patterns include:
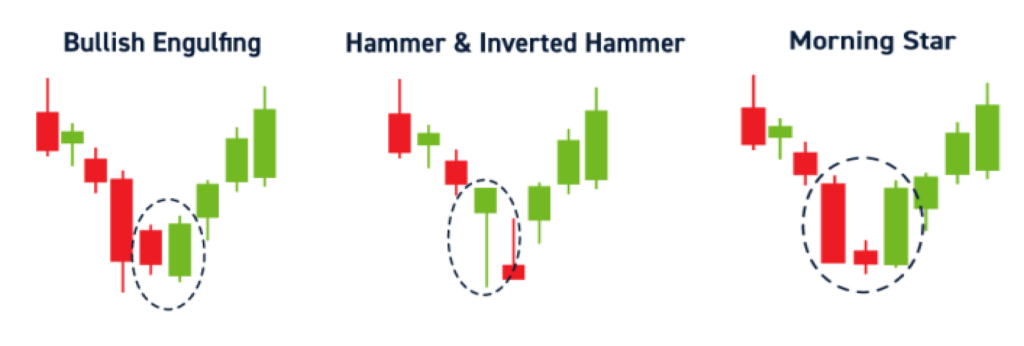
- Hammer: A single candlestick with a small body and a long lower wick resembling a hammer – shows bearish to bullish shift in trend.
- Bullish Engulfing: This occurs when a modest bearish candlestick is carried out by a larger bullish one that totally engulfs it. It implies a strong shift towards bullish sentiment.
- Morning Star: Consists of three candlesticks—a bearish candlestick, a small indecisive candlestick, and a large bullish candlestick. This means the market will turn bullish from bearish.
Source: CentrePoint Securities
2. Bearish Candlestick Patterns
Bearish patterns indicate a potential downward price movement and reflect selling pressure in the market. Some popular bearish patterns are:
- Shooting Star: A candlestick with a small body and a long upper wick resembling a shooting star. It indicates that the trend could change from bullish to bearish.
- Bearish Engulfing: The opposite of bullish engulfing, where a small bullish candlestick is followed by a larger bearish candlestick that engulfs the previous candle. It indicates a strong shift towards bearish sentiment.
- Evening Star: Comprises three candlesticks—a bullish candlestick, a small indecisive candlestick, and a large bearish candlestick. It shows a possible change from a rise to a downtrend.

Source: FBS Markets Inc
3. Indecisive Candlestick Patterns
Indecisive patterns, also known as neutral or continuation patterns, occur when there is uncertainty or a temporary pause in the market. Some commonly observed indecisive patterns include:
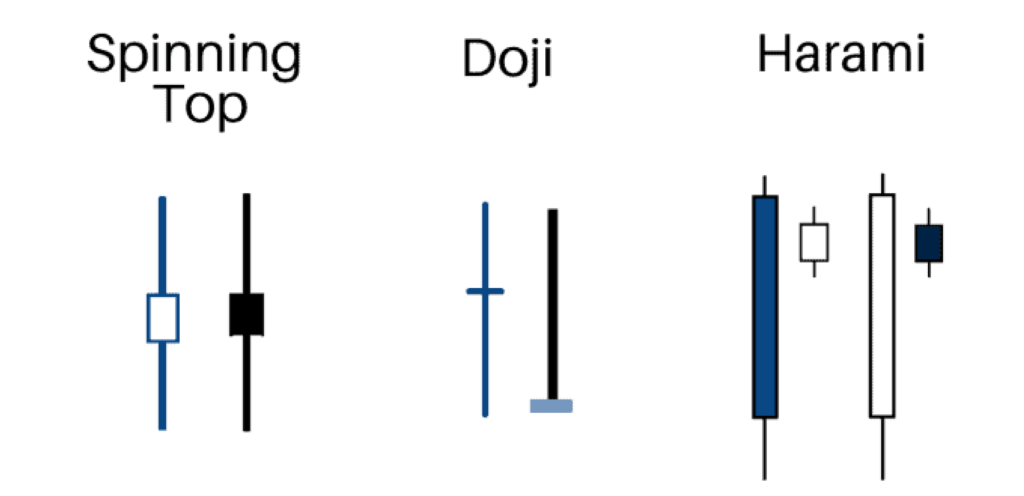
- Doji: A candlestick with a small body, indicating that the open and close prices are nearly the same. It shows a balance between buyers and sellers.
- Spinning Top: Similar to a Doji, but with small upper and lower wicks. It indicates indecision in the market.
- Harami: Involves two candlesticks, where a small candlestick is completely engulfed by the body of the previous larger candlestick. It signifies a potential pause in the prevailing trend.
Source: Trading Sim
How to Do Candlestick Trading?
As a novice trader, it’s crucial to avoid the mistake of relying solely on a single candlestick pattern as a trading signal. To enhance your trading strategy, it’s highly recommended to combine candlestick patterns with other indicators. Combining indicators is a common practice among successful traders and can greatly improve decision-making. Here is how you can do candlestick trading using different indicators.
1. Candlestick Trading with Trend lines
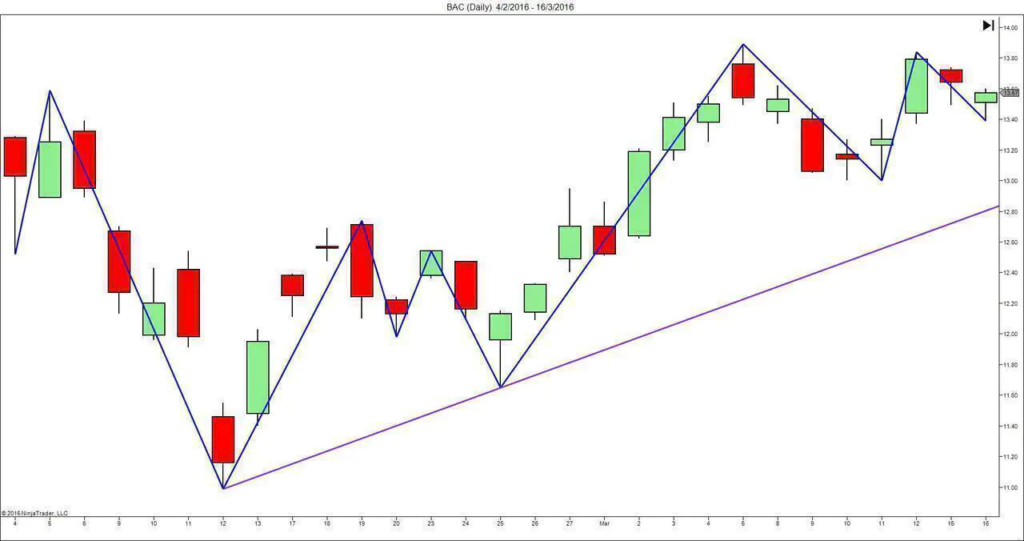
Candlesticks and trendlines are vital tools for analyzing price movements. Candlesticks reveal market sentiment and potential reversals, while trendlines help identify support and resistance levels
By combining these indicators, you can gain insights into market trends, entry and exit points, and overall market conditions.
Source: Trading Setups Review
2. Candlestick Trading with Retracement
When using candlesticks with retracement, you observe price movements on the chart and identify key support and resistance levels. Look for bullish or bearish candlestick patterns near these levels, indicating potential reversals or continuations.
Use Fibonacci retracement levels to gauge the extent of price pullbacks. Combine candlestick signals with retracement analysis to make more informed trading decisions and increase your chances of success.

Source: Forex Trading
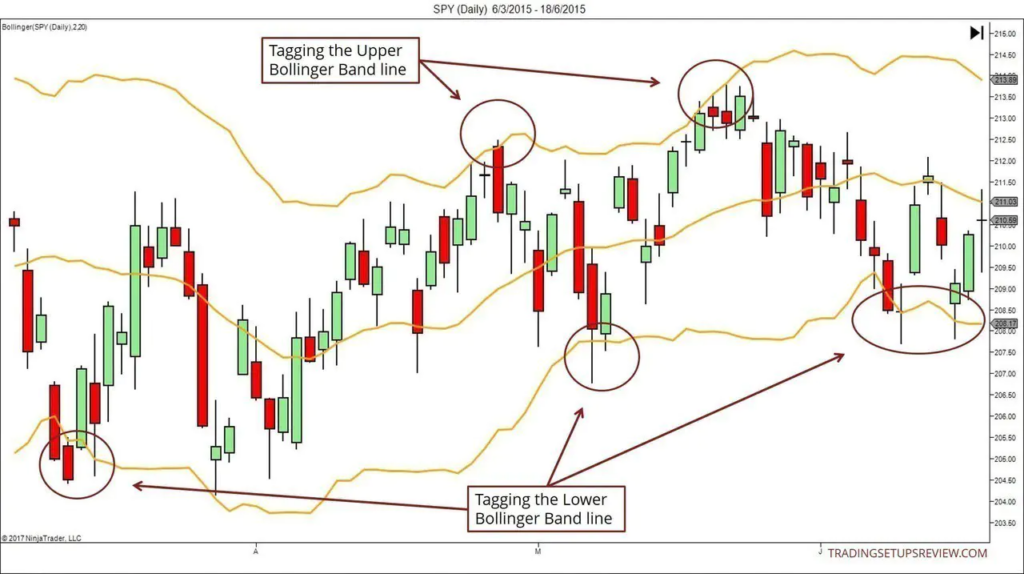
3. Candlestick Trading with Bollinger Bands
When using candlestick charts with Bollinger Bands, pay attention to the interaction between the candlesticks and the bands. Candlestick patterns near the upper or lower bands can indicate potential reversals or breakouts.
Additionally, a narrowing bandwidth suggests low volatility, while an expanding width indicates increased volatility. Combine these tools to gain insights into price trends and potential trading opportunities.
Source: Trading Setups Review
4. Candlestick Trading with Moving Averages
Using candlestick charts in conjunction with moving averages helps you identify trends and confirm potential trade signals. Moving averages smooth out price fluctuations and visually represent the overall trend.
Combined with candlestick patterns, they enhance your ability to make informed trading decisions based on short-term price movements and the broader market context.

Source: Zerodha
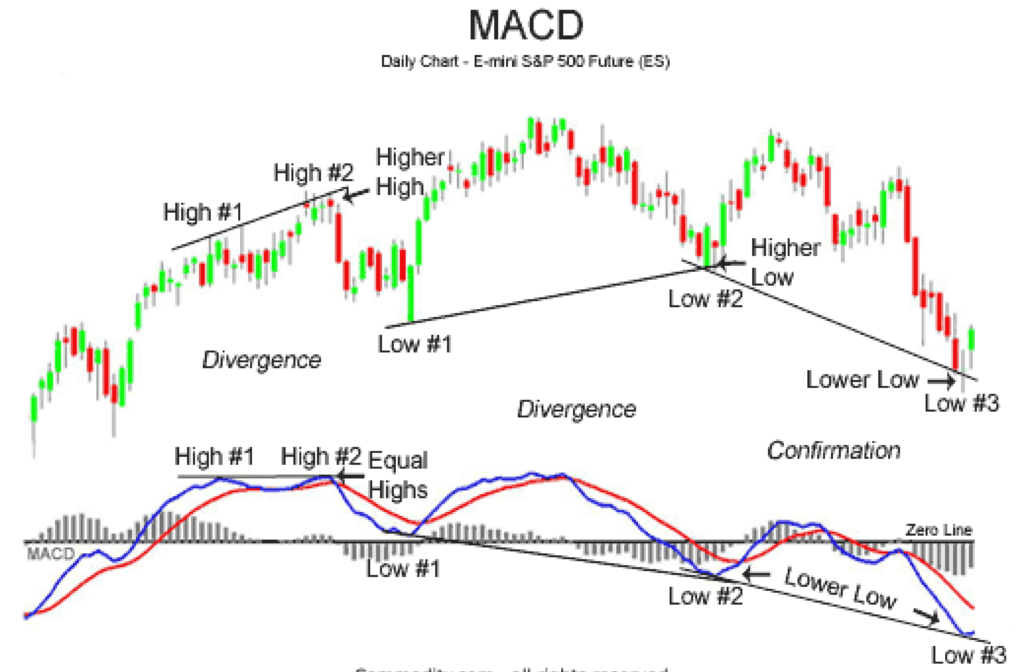
5. Candlestick Trading with MACD
Candlesticks reveal price action, while MACD tracks momentum and trend strength. Use bullish or bearish candlestick signals in conjunction with MACD crossovers or divergences for enhanced trading decisions.
Identify potential reversals or continuations by integrating the visual cues of candlesticks with the quantitative insights provided by the MACD, ultimately optimizing your trading strategy.
To learn more about candlestick patterns, you can also consider taking a course on Upsurge.club. Upsurge.club offers comprehensive and one of the best candlestick trading courses, which can help you interpret and utilize candlestick patterns effectively for successful trading.
Source: Candlestick Charts
Conclusion
You have now been introduced to candlestick trading. By understanding the various patterns and their significance, you have taken the first step towards becoming a skilled trader. Remember to apply these techniques with patience and discipline, and always prioritize risk management.
As you continue your journey, don’t forget to learn and stay updated with market trends continually. If you are looking to delve deeper into candlestick trading and learn technical analysis, consider exploring Upsurge.club for the best candlestick trading course.

