When it comes to trading in the financial markets, understanding price action is crucial. One powerful tool that traders rely on is candlestick patterns. These patterns, derived from the ancient Japanese method of technical analysis, provide valuable insights into market sentiment and can help predict future price movements. In this article, you will be exploring different candle rules in trading and how they can be effectively used to enhance your trading strategies.
The Basics of Candlestick Patterns
Before diving into the various candle rules, let’s start with the basics. Candlestick patterns are formed by the combination of different candlestick shapes and their positions relative to each other. Each candlestick represents a specific time frame (e.g., one day, one hour) and contains four essential components: the opening price, the closing price, the high price, and the low price. By analyzing the relationship between these components, traders can gain insights into market dynamics and make more informed trading decisions.
Let us now explore the various candlestick patterns with which you can relate the fluctuation in the market. Through these patters you will be able to make wise decisions and continue trading. Some of the candlestick patterns are as follows:
1. The Bullish Engulfing Pattern
One popular candlestick pattern is the Bullish Engulfing pattern. This pattern consists of two candles and is formed during a downtrend. The first candle has a smaller body, indicating selling pressure. The second candle, however, has a larger body that completely engulfs the previous candle, signaling a potential shift in market sentiment.
It suggests that buying pressure has overwhelmed selling pressure, potentially leading to a bullish reversal. Traders often look for confirmation through the increased trading volume to validate the significance of the Bullish Engulfing pattern.
Source: DailyFX
2. The Bearish Harami Pattern
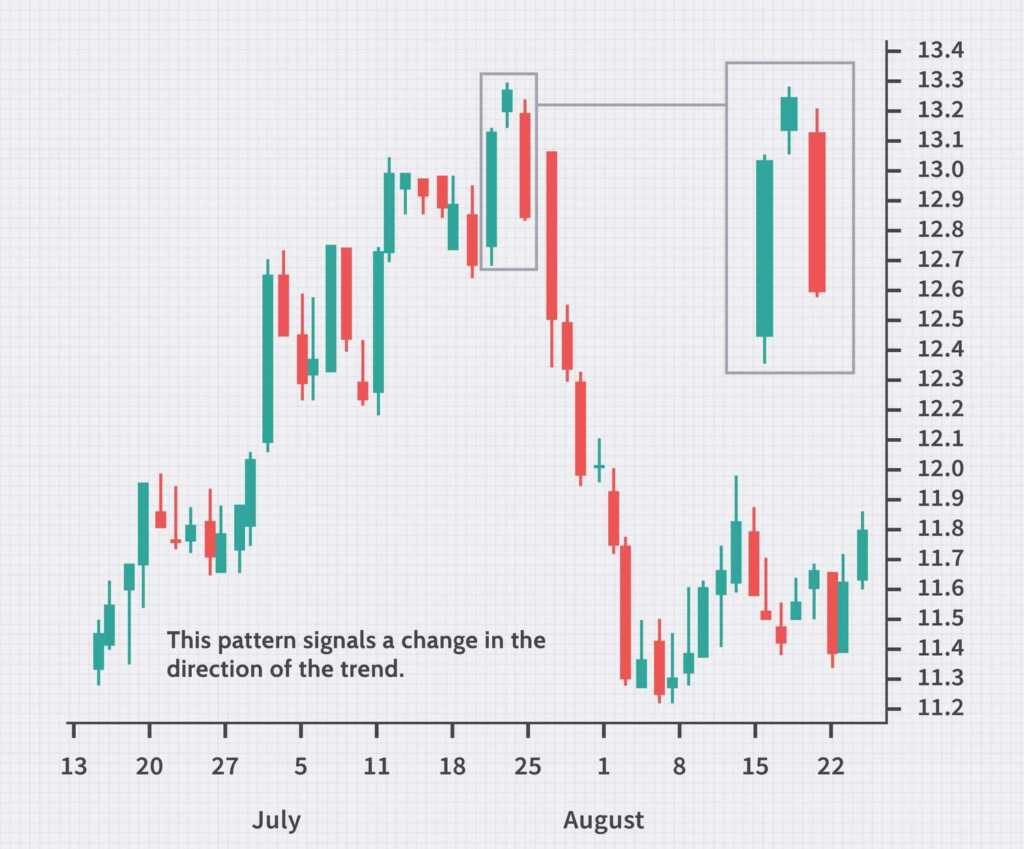
On the other side of the spectrum, we have the Bearish Harami pattern, which is formed during an uptrend. Like the Bullish Engulfing pattern, the Bearish Harami consists of two candles. The first candle has a large body, indicating buying pressure. The second candle, however, has a smaller body that is completely engulfed by the previous candle’s body.
This pattern suggests a potential shift in market sentiment from bullish to bearish, indicating a possible trend reversal. Confirmation through other technical indicators or price action is essential before making trading decisions based on the Bearish Harami pattern.
Source: Elearnmarkets
3. The Doji Pattern
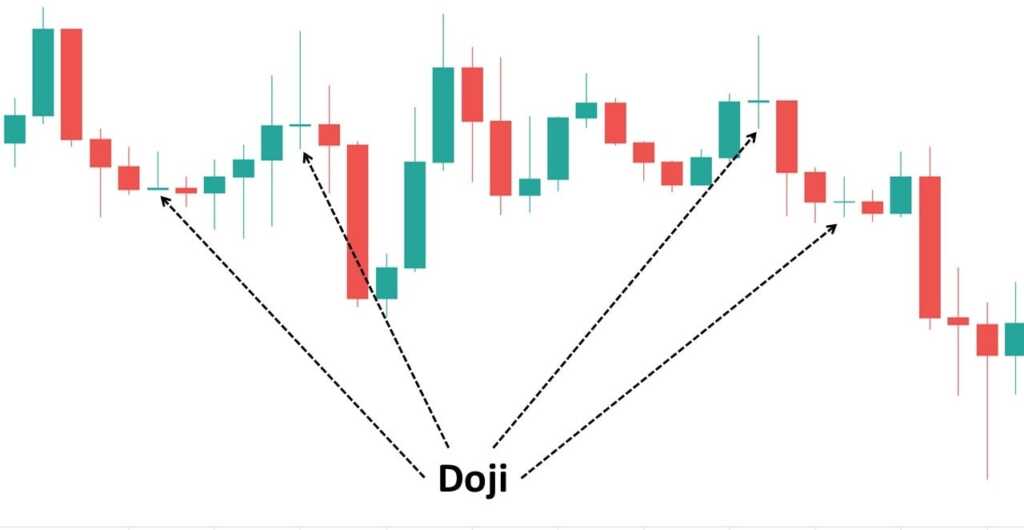
The Doji pattern is characterized by a candle with a small or no body. It occurs when the opening and closing prices are very close or equal. The Doji represents market indecision, with buyers and sellers in a balanced tug-of-war. This pattern can occur in both uptrends and downtrends and is often seen as a potential trend-reversal signal.
However, it is important to note that Doji patterns require a confirmation from other technical tools or price action before making trading decisions.

Source: How to Trade Blog
4. The Morning Star Pattern
The Morning Star pattern is a three-candle pattern that appears during a downtrend. The first candle is a bearish candle, indicating selling pressure. The second candle is a small-bodied candle that reflects market indecision. The third candle is a bullish candle with a larger body that confirms a potential trend reversal.
The Morning Star pattern suggests that buying pressure is gaining momentum and may lead to a bullish trend. Traders often consider factors like trading volume and the position of the pattern in the overall price chart for additional confirmation.
Source: Indiacharts
5. The Evening Star Pattern
Similar to the Morning Star pattern, the Evening Star pattern is a three-candle pattern, but it appears during an uptrend. The first candle is a bullish candle, indicating buying pressure. The second candle is a small-bodied candle that reflects market indecision. The third candle is a bearish candle with a larger body, confirming a potential trend reversal.
The Evening Star pattern suggests that selling pressure is gaining momentum and may lead to a bearish trend. Traders should look for additional confirmation before making trading decisions based on this pattern.

Source: Investopedia
Learning and Applying Candlestick Patterns
Studying candlestick patterns is an ongoing learning process. To effectively incorporate these patterns into your trading strategies, it is crucial to dedicate time and effort to learn and practice. Numerous resources are available to enhance your understanding of candlestick patterns, including online courses and books specifically focused on this topic.
Upsurge.club offers a comprehensive Candlestick Trading course that can provide you with valuable insights and practical knowledge to master these patterns and improve your trading skills.
Implementing Candlestick Pattern Rules
To effectively implement candlestick pattern rules in your trading, consider the following key points:
- Confirmation: Always seek confirmation from other technical indicators, price action, or volume before making trading decisions based solely on candlestick patterns.
- Risk Management: Incorporate proper risk management strategies, including setting stop-loss orders and determining your risk-reward ratio, to protect your capital.
- Backtesting: Use historical data to backtest different candlestick patterns and their performance in various market conditions. This will help you gain confidence in their reliability.
- Continuous Learning: Stay updated with new candlestick patterns, variations, and their significance by attending seminars, reading books, and engaging in ongoing learning. The financial markets are dynamic, and staying ahead requires a commitment to learning.
Conclusion
Mastering candlestick trading patterns requires time, practice, and a commitment to continuous learning. By understanding the different candle rules and their significance, you can gain valuable insights into market sentiment and potential trend reversals. Remember to always seek confirmation, manage your risks effectively, and engage in backtesting to refine your trading strategies.
To further enhance your knowledge and skills in candlestick trading, consider enrolling in Upsurge.club’s Candlestick Trading course. This comprehensive course will provide you with a deeper understanding of candlestick patterns and their application in real-world trading scenarios. Start your journey towards becoming a proficient candlestick trader and take advantage of the opportunities presented by the financial markets.


